Rodrigo Oliveira

Aerospace Engineering Student - Maker - Trombonist - Plane Nerd
|
|
|
|
|
Quick Random Project #1: A Spinning Donut!
04 Oct 2020 -
As for many of my other projects, the idea for this one came about while wandering through Youtube. I found an awesome video called Donut-shaped C code that generates a 3D spinning donut showing the code written by Andy Sloane. I don’t know much about how rendering works, but the idea behind the code is really cool: creating a 3D surface and making it interact with a light vector to create a 2D projected image. Andy wrote his code in C, so I thought it would be nice to implement his idea (or part of it) in Python. I used Matplotlib to display the 2D projections of the 3D points. Andy Sloane wrote a really good small article about the code, in which he goes into a lot more detail than I will, so if you want to implement it yourself, I highly recommend reading it.
Main ideas
Generating the donut(or torus) points:

It is obtained by rotating a circle with distance R2 from the origin by 360 degrees. As you can see in the image, any point in the donut is described by projecting R1 and R2 in the x, y and z axis. R1 and R2 are constants and θ and φ range from 0 to 2π.
Rotating the donut
Rotating a point in the donut is just like making coordinate transformations in any other point in space. We use one rotation matrix for each axis of rotation.
Calculating Luminance
The luminance is defined as the dot product of the light vector and the surface normal. The light vector is arbitrary, and the surface normal can be obtained by:
The dot product of these two vectors will give us the cosine of the angle with which the light hits the surface at that particular point, the higher the value, the more light hits the surface
Projecting points
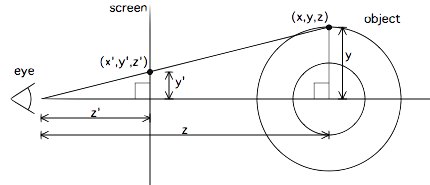
The coordinates we need to plot the torus are x’ and y’. And:
We just call z’ K1 to make it obvious that it is a constant. The same goes for x’. But projecting like this, our perspective is from the center ot the torus, so we need to put it a bit further away:

So, without further ado, this is the current code:
import numpy as np
import matplotlib.pyplot as plt
import imageio
images = []

# Declaring parameters
R2 = 3
R1 = 1
resol = 45
k2 = 5
k1 = 40

# Creating the theta-phi grid
theta = np.linspace(0, 2*np.pi, resol)
phi = np.linspace(0, 2*np.pi, resol)
theta, phi = np.meshgrid(theta, phi)

for a in np.linspace(0, 2*np.pi, 37):
    # Normal vector
    n = np.array([ np.cos(a)* np.sin(phi)*(R1* np.cos(theta)+R1)*(R1* np.sin(a)* np.cos(phi)* np.sin(theta)+R1* np.cos(a)* np.cos(theta))+
    np.sin(a)* np.sin(phi)*(R1* np.cos(theta)+R1)*(R1* np.sin(a)* np.cos(theta)-R1* np.cos(a)* np.cos(phi)* np.sin(theta)),
    R1* np.cos(a)* (np.sin(phi)**2)*(R1* np.cos(theta)+R1)* np.sin(theta)- np.cos(phi)*(R1* np.cos(theta)+R1)*
    (R1* np.sin(a)* np.cos(theta)-R1* np.cos(a)* np.cos(phi)* np.sin(theta)), np.cos(phi)*(R1* np.cos(theta)+R1)*
    (R1* np.sin(a)* np.cos(phi)* np.sin(theta)+R1* np.cos(a)* np.cos(theta))+R1* np.sin(a)* (np.sin(phi)**2)*(R1* np.cos(theta)+R1)* np.sin(theta)])

    # Creating the light vector
    l = np.array([0, 0.25, -2])

    # Dot product in the theta-phi space
    lumin = np.zeros((resol, resol))

    # Populating the lumin matrix (one luminance value for each theta-phi pair)
    for i in  range(resol):
        for j in range(resol):
            lumin[i, j] = np.dot(l, n[:, i, j])
    # Obtaining the torus points to plot
    X = np.sin(phi)*(R1* np.cos(theta)+R1)
    Y = R1* np.cos(a)* np.sin(theta)- np.sin(a)* np.cos(phi)*(R1* np.cos(theta)+R1)
    Z = R1* np.sin(a)* np.sin(theta)+ np.cos(a)* np.cos(phi)*(R1* np.cos(theta)+R1)

    # Project the 3D points into the 2D canvas
    xy = np.array([(k1*X)/(k2 + Z), (k1*Y)/(k2 + Z)])

    # Plotting the projected points: the luminance determines the marker size
    plt.style.use("dark_background")
    plt.scatter(xy[0,:,:], xy[1,:,:], s=-lumin)
    plt.xlim(-20, 20)
    plt.ylim(-20, 20)
    plt.savefig('Image%i.png'%a)
    plt.close()
    images.append(imageio.imread('Image%i.png'%a))
    imageio.mimsave('movie.gif', images)
What is missing?
Obviously, the donut shape! With indentation being so important in Python, I guess it would be more difficult. If you read Andy’s article, you might also notice that I did not write the z buffer: the piece of code that makes the program not plot points that are behind other points. Although it is not as complete as the original code, my Python script was a great oportunity to understand a bit more about rendering 3D images and remembering some important analytic geometry concepts. So this useless project wasn’t useless afterall! Maybe I should write about the importance of useless projects, don’t you think?